


Explore results and analytic products related to country progress in RMNCAH-N

Countries to be launched...
COUNTRY PROFILE
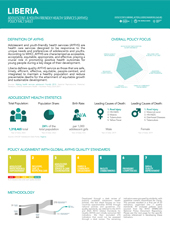
Liberia
GFF Partner Country Liberia
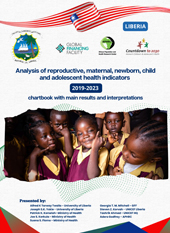
The GFF supports Liberia’s investment case to close equity gaps in service delivery and health outcomes for women and children by focusing available resources on counties where progress has lagged. The first investment case was concluded in 2020 and now the GFF is in the process of supporting the country to develop a new IC.
Under the government’s leadership, the GFF is helping to strengthen frontline health care facilities and reform health financing through resource mapping and expenditure tracking and strengthening strategic purchasing of health services. The government has piloted a strategy to reduce drug stockouts which is now being integrated across the health system.
To promote accountability, the government works with the GFF to strengthen engagement with civil society organizations and strengthen civil registration and vital statistics systems. The GFF is also supporting policy dialogue to improve women's and girls’ access to sexual and reproductive health services.
Country Routine and Project Indicators by Priority Area
This section presents a selection of country routine and project indicators tagged across national priorities and GFF areas of engagement. Users can select a thematic card to view the indicators grouped under that area of engagement and visualize corresponding national and subnational trends in the implementation progress section, where available. Because indicators are relevant to multiple strategic priorities, please note that some may appear under more than one category.
Implementation Progress Data
This section includes selected indicators from the Investment Case Results Framework, Health Financing priorities, and the relevant World Bank projects. Indicators have been tagged by technical programmatic areas to support thematic analysis and visualization. Use the dropdown menu to select an indicator and view the corresponding data. Where subnational data is available, the map will display either time trends or the most recent data for each region. Hovering over the map reveals additional details for the selected indicator, and clicking on a region adds it to the chart on the right. All data, including source information, can be downloaded by clicking the arrow next to the indicator dropdown.
Implementation Progress
Indicator
Indicator:
Source:
Impact Indicators
This section presents core impact indicators for RMNCAH-N and health financing. These indicators track health outcomes and financing performance, aligned with global targets to support evidence-based planning and resource allocation.
Core RMNCAH-N Impact Indicators
The 8 GFF core impact indicators reflect updates aligned with the in-country survey schedule which optimally occurs once every three to five years to determine population-based changes in important health and nutrition outcomes. These indicators are core to the GFF Logic Model, to reflect impact of aligned interventions over time.
CORE RMNCAH-N IMPACT INDICATORS
Note:
The GFF highlights progress between the two most recent point estimates from population-based surveys approved by countries. The timing of the data points is dependent on when survey data are available, which introduces lags. In addition, it has been demonstrated that stillbirths tend to be under-reported in population based surveys1.
Source:
Alternative Data Sources:
For many of the indicators highlighted in this table, annual estimates are produced through global processes. The globally produced estimates can be found through the following sites:
Core Health Financing Indicators
The six GFF core health financing indicators track changes to country budget and expenditures with a focus on health spending, to monitor the expected impact of increasing the total volume and value of funding allocated to health and nutrition. The GFF partnership supports financing reforms by engaging with ministries of finance and ministries of health to strengthen mobilization of domestic resources as well as allocative and technical efficiency. These indicators are tracked through country-specific data sources such as BOOST, NHA, and budget reports. Expenditure data are tracked through the Global Health Expenditure Database (GHED), for which data are available through the end of 2018. Through measurement of budgets and expenditures, the GFF partnership aims to accelerate the expansion of interventions that are high-impact, cost-effective, affordable, and feasible to accelerate progress on universal health coverage and in achieving SDG targets.
CORE HEALTH FINANCING INDICATORS
Source:
Survey and Estimated RMNCAH-N Coverage
The Liberia team collaborated with Countdown to 2030 and GFF in an analysis workshop in Nairobi Kenya, in June April, 2025. As a result of that workshop the team estimated coverage of key service delivery indicators for participating countries that can be found in this link.
The RMNCAH-N coverage data includes a standard set of 15 RMNCAH-N coverage indicators from available population-based surveys from 2012 to the most recent available survey. These indicators show progress towards key goals across maternal, child, and adolescent health and nutrition outcomes. Additional key nutrition-sensitive and/or education-specific coverage indicators are presented for countries where the GFF co-finances a nutrition-focused World Bank project or where education is a strong focus of the IC.
The RMNCAH-N coverage data are sourced from the most recent available population-based surveys.
Resource Mapping
Resource mapping is a key component of the GFF approach. The resource mapping exercise helps countries assess funding gaps, align donor and government resources, and improve the efficiency and equity of health spending. Resource mapping data for each country varies based on whether countries have completed one or more resource mapping exercises.
Resource Mapping
Source:
Data and Analytics Partnerships
The GFF works in close collaboration with governments and technical partners to strengthen national data systems and promote the use of evidence for decision-making. Through initiatives such as FASTR, AdLAB, Countdown and MAGE, countries are supported to generate, analyze, and apply data to improve planning, equity, and accountability for women, children, and adolescents’ health. Learn more about these partnerships and how they support country-led and results-driven efforts.
Adolescent Learning, Action and Benchmarking
AdLAB (Adolescent Learning, Action and Benchmarking) strengthens national capacity to analyze and use data for adolescent and youth health. It promotes the use of evidence for scalable solutions and engages stakeholders to ensure health systems are responsice to adolescents' needs.
Countdown to 2030
Countdown works with countries to analyze health trends and equity gaps. It supports subnational tracking and data use to improve planning and resource allocation for RMNCAH-N priorities through technical collaboration and capacity strengthening.
Monitoring and Action for Gender and Equity
MAGE (Monitoring and Action for Gender and Equity) supports data and analyses for prioritizing and tracking reforms that advance gender equality and women's, children's, and adolescents' health. It supports countries to generate and use data and analyses for more gender equitable health systems and services.